What is Spectroscopy?
Spectroscopy is the use of electromagnetic radiation (light) to study matter. At the microscopic level (e.g., atoms and molecules), matter is too small to observed directly. One of the most successful ways of studying atoms and molecules has been to observe how they respond to light. By studying this interaction and applying models (e.g., rigid rotor and harmonic oscillator models), information on both the structure and behavior can be obtained. For example, the structure of an atom or molecule determines the wavelength and amount of light that it absorbs, emits, or scatters light. Spectroscopy experiments can therefore be used to identify atoms and molecules, and to further investigate the details of their structure and behavior. A working knowledge of quantum mechanics is often needed in order to study the details of atomic and molecular spectroscopy.
What is High Resolution Gas Phase Spectroscopy?
High resolution gas phase spectroscopy is the detailed study of molecules (i.e., molecular structure, chemical kinetics, reaction dynamics) in the gas phase, where spectra often show a large number of peaks due to changes in the molecule's electronic, vibrational, and rotational motions and energy. The spectra are exquisitely sensitive to the molecule's structure and behavior. A major problem for all but the smallest and simplest of molecules, however, is the enormous number of peaks that cause severe spectral congestion. For many molecules (especially medium and large sized molecules), the congestion is nearly impossible to deal with. Our group aims to deal with these problems by developing new coherent multidimensional techniques that can address this problem.
What is Coherent Multidimensional Spectroscopy?
Our research group is developing new forms of high resolution coherent 2D and 3D spectroscopy that are aimed at dealing with the enormous spectral complexity found in gas phase electronic spectroscopy. As mentioned earlier, the number of peaks is often daunting (10,000 – 1,000,000) due to the large number of allowed transitions between a huge number of energy levels (each with a different electronic, vibrational, and rotational energies).
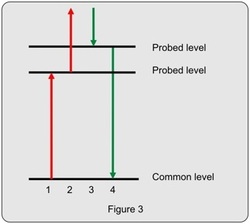
Newly developed 2D techniques such as those based upon the four wave mixing diagram shown to the left can help deal with this problem by redistributing peaks in readily identifiable patterns, where peaks are sorted by rotational and vibrational quantum numbers and selection rules. The resulting spectrum is "two-dimensional" because the intensity of the generated light is plotted as a function of two frequencies (i.e., the first and the last (fourth) field in this four wave mixing diagram. As we vary the frequencies of the first and fourth fields, the intensity of the generated light is resonantly enhanced whenever the frequency of the field matches a natural resonance of the molecule. Huge resonance enhancements occur when both the first and the fourth field achieve resonance enhancements that involve the same common level (the ground state). This "doubly resonant" condition occurs when both of the probed levels have rotational quantum numbers that differ from that of the ground state by one unit (i.e., J' = J" +/- 1).
Newly developed 2D techniques such as those based upon the four wave mixing diagram shown to the left can help deal with this problem by redistributing peaks in readily identifiable patterns, where peaks are sorted by rotational and vibrational quantum numbers and selection rules. The resulting spectrum is "two-dimensional" because the intensity of the generated light is plotted as a function of two frequencies (i.e., the first and the last (fourth) field in this four wave mixing diagram. As we vary the frequencies of the first and fourth fields, the intensity of the generated light is resonantly enhanced whenever the frequency of the field matches a natural resonance of the molecule. Huge resonance enhancements occur when both the first and the fourth field achieve resonance enhancements that involve the same common level (the ground state). This "doubly resonant" condition occurs when both of the probed levels have rotational quantum numbers that differ from that of the ground state by one unit (i.e., J' = J" +/- 1).
What does a high resolution coherent 2D spectrum look like?
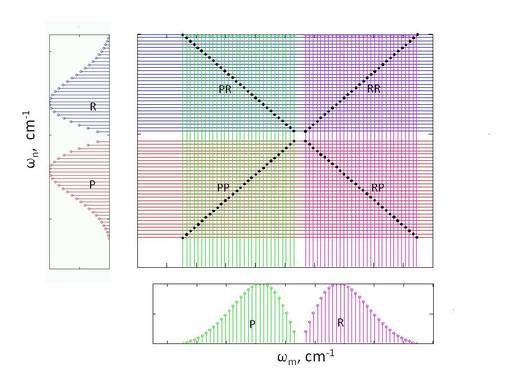
A coherent 2D spectrum (plot of the intensity as a function of two independent frequencies along the x and y axes). The intensity of the generated light increases whenever field frequencies match the frequencies of natural resonances in the molecule. If two fields are simultaneously resonant, the resulting doubly resonant signals will be even more intense.
The figure on the left shows a set of rotationally resolved 1D peaks on the left, and a different set of rotationally resolved 1D peaks on the bottom. These two sets might be associated with two different vibronic transitions in the molecule. The larger rectangular corresponds to a coherent 2D spectrum, where singly resonant lines are drawn vertically and horizontally at the same frequencies as the peaks in the 1D plots. The points at which the horizontal and vertical lines intersect are potential doubly resonant peaks. However, the only points of intersection that satisfy selection rules are marked by the black dots. Therefore, the coherent 2D spectrum is dominated by a series of doubly resonant peaks that form an X-shaped structure.
The figure on the left shows a set of rotationally resolved 1D peaks on the left, and a different set of rotationally resolved 1D peaks on the bottom. These two sets might be associated with two different vibronic transitions in the molecule. The larger rectangular corresponds to a coherent 2D spectrum, where singly resonant lines are drawn vertically and horizontally at the same frequencies as the peaks in the 1D plots. The points at which the horizontal and vertical lines intersect are potential doubly resonant peaks. However, the only points of intersection that satisfy selection rules are marked by the black dots. Therefore, the coherent 2D spectrum is dominated by a series of doubly resonant peaks that form an X-shaped structure.
Why is high resolution coherent 2D spectroscopy useful for dealing with spectral congestion?
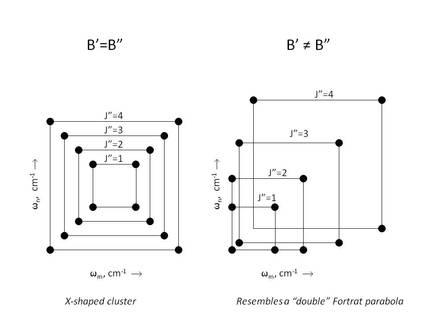
The simplest result is the creation of an X-shaped pattern, where each peak is created by a double resonance (e.g., the first and the fourth field are involved in separate resonances that both involve the same common level. This X-shaped pattern results when the spectroscopic rotational constants in lower and upper levels are approximately equal. In such a case, the peaks are systematically organized according to rotational quantum number and selection rule (see the figure on the far left). All of the peaks within one of these patterns have the same vibrational quantum numbers, and they all involve the same electronic states. Therefore, peaks are automatically sorted and organized in the 2D spectrum, without the need for additional sorting algorithms typically needed for analyzing conventional 1D spectra. High resolution coherent 2D spectroscopy can be used to find patterns for molecules that otherwise yield patternless conventional (1D) spectra.
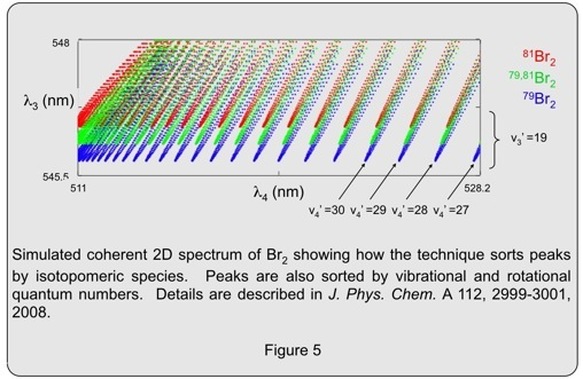
The ability to sort peaks into patterns can be extremely useful. For example, in high resolution coherent 2D spectra of the bromine molecule, the peaks are also sorted by isotopologue; the clusters for the three different isotopologues are centered along different rows in the 2D spectrum. (See Figure 5 below)
If the rotational constants of the common and probed levels are significantly different, the resulting pattern is distorted and can appear as a pair of parabolas (a double Fortrat parabola). However, the peaks are still sorted into groups of 4 by rotational quantum number
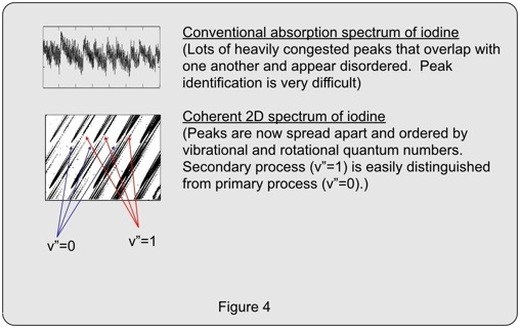
Regular repeating patterns are easier to find in the coherent 2D spectrum of iodine (bottom) compared to the conventional absorption spectrum of iodine (top).
High Resolution Coherent 2D spectroscopy of nitrogen dioxide

The spectrum to the left shows an X-shaped pattern produced by the nitrogen dioxide molecule. This molecule has long resisted analysis; despite its simple structure, NO2 has a notoriously complex spectrum that covers the entire visible region. A series of low-lying conical intersections cause mixing effects, making peak positions appear chaotic. The resulting spectrum appears largely patternless throughout the visible region. As a result, almost all peaks in this region have remained unassigned for many decades. However, as shown in this figure, x-shaped rotational patterns are easily observed when using high resolution coherent 2D spectroscopy. For rotational patterns that appear clear in the coherent 2D spectrum, peak assignments are relatively easy and straightforward. However, many patterns overlap and remain congested even in the 2D plot. In order to address this problem, we are currently developing a high resolution coherent 3D spectroscopic technique.
